One of the most comprhensive Patent database and intelligence tool
De Science Infoware has entered with a strtegic alliance with ‘Gridlogics Technologies’ for their Flagship, state of art, comprehensive and easy to use platform. PatSeer is a powerful Patent search solution built to handle extreme needs of patent searchers and patent information professionals. Weather it is Global Covergae, complex search Scripts, nested or chained proximities, raid drawing review or flexible exports, it’s all there.
PatSeer included more than 12 million Semantic Rules, Patent, Scientific Journals, Clinical Trials which is embeded through AI driven capabilities, Ethical AI, with Semantic Search,Intelligent Categorisation, Predictive Analytics, Missed results suggester.
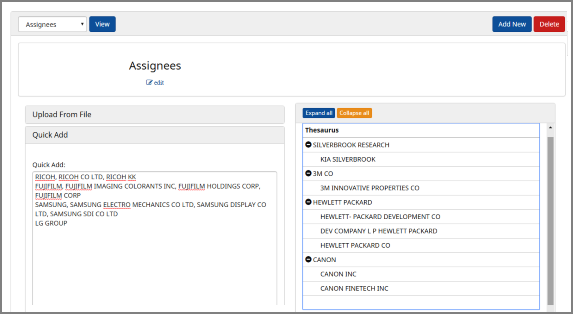
Patseers is a very important solution for R&D driven organisations who want to give smart global Patent search accessto research professionals across the firm. Reviewing results, download pdf or se of drawings
Request for a Quote
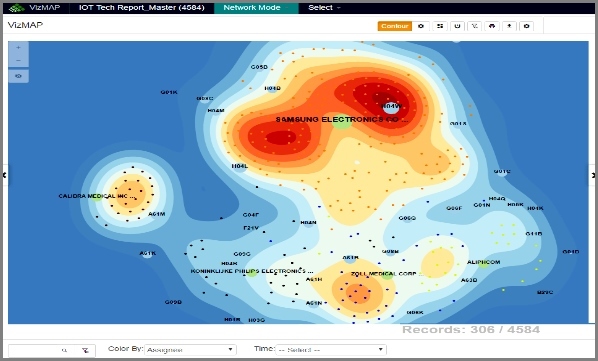
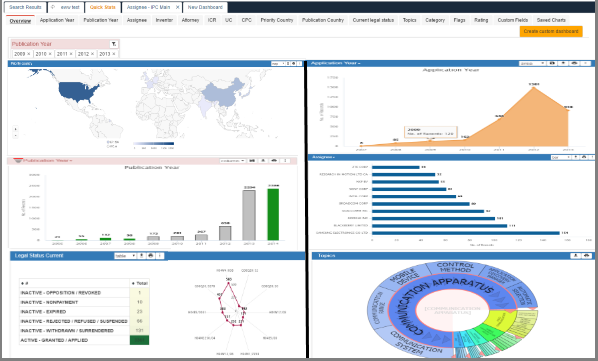
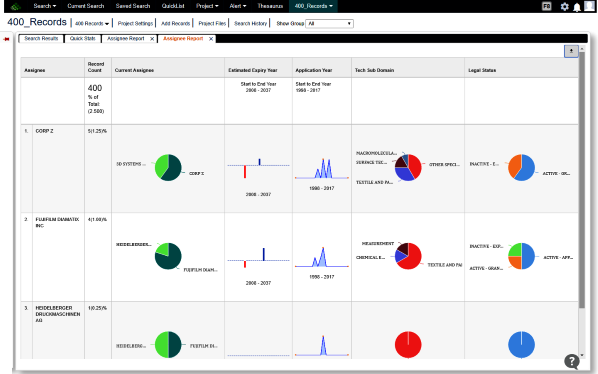
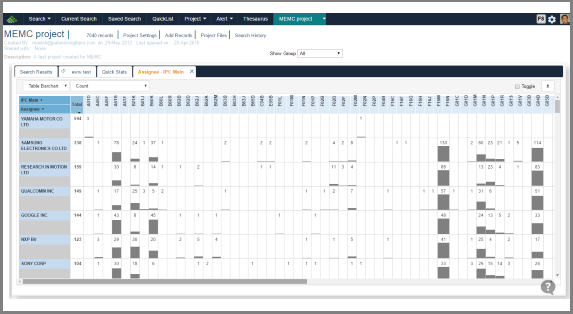
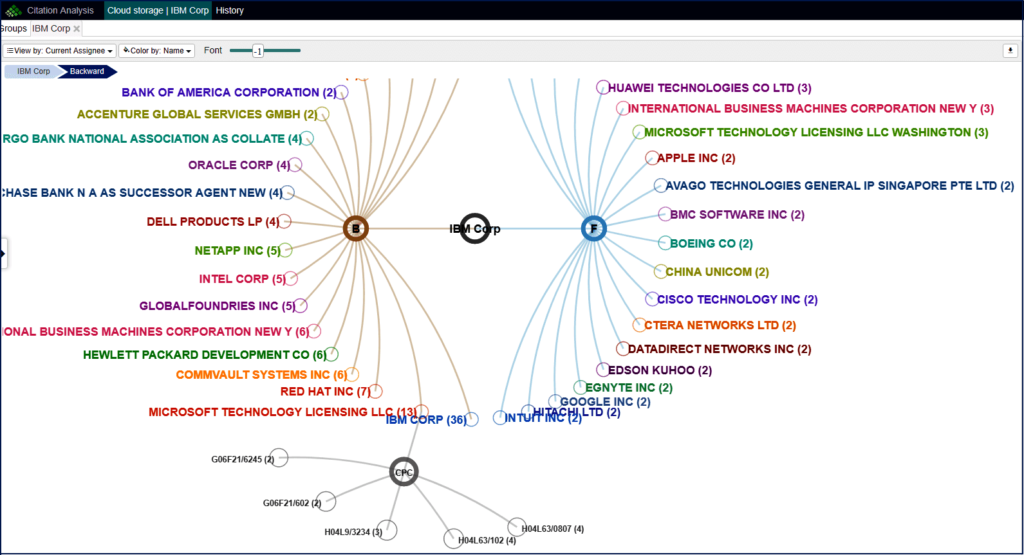
No fake promises. Just serious analysis tools with great looking interactive visualizations!
Feeling let down by “business ready” workflows and black-box automated insights ? Join the community of IP managers and competitive intelligence professionals who can get answers to questions that are need-of-the-hour and don’t rely on a tool to throw up [sic] all sorts of charts that do not matter or (worse) make sense. These users know that flexibility is key for IP analysis that makes business impact because no two business needs are same.
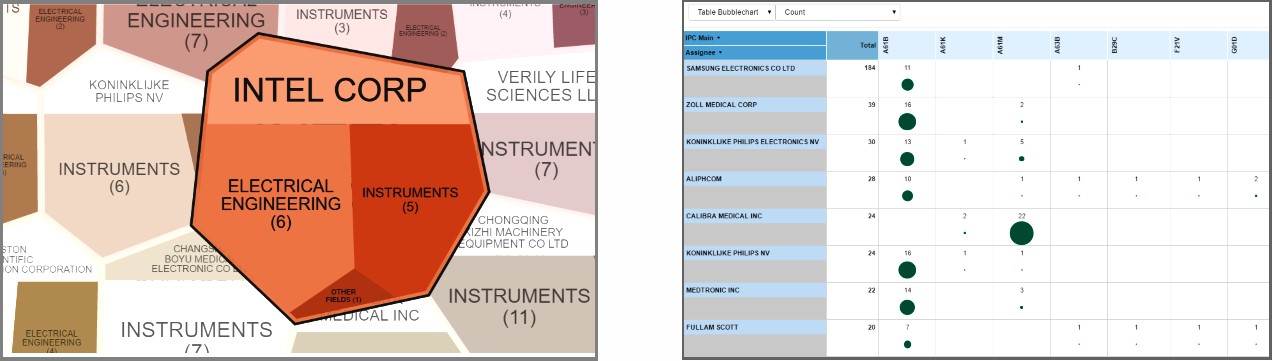
With PatSeer Pro you now have the flexibility you were looking for in a single integrated web based analysis platform.
Stop wasting time exporting patents just to analyze them
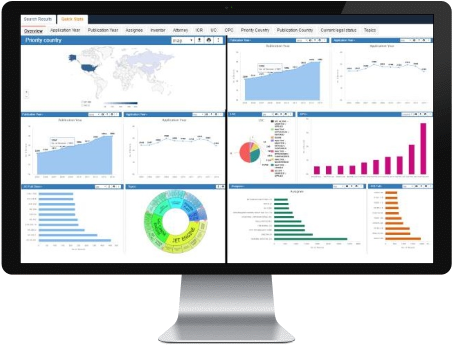
When you can analyze patents and non-patent literature in an integrated online platform why bother wasting time in export/import of data! Pro Edition of PatSeer is all about saving time and getting to the insights quickly. And did we mention that PatSeer holds the world’s most comprehensive patent database collection.
Big data analytics? With 129+ Million records, IP is big data!
PatSeer Pro takes advantage of Gridlogics’s 11+ years expertise in patent text mining and visualisations platforms. To make it all possible on the web, we have now combined the best of big-data analytic techniques to make sure your analysis show up in seconds!